Medical Data and Analysis: Female Arthritis Patients With Abnormal Test Results Insured by Blue Cross

This page provides information on female arthritis patients with abnormal test results insured by Blue Cross. The data for these patients is shown below. Following this dataset, three charts examining different subsets of the data are displayed along with analysis.
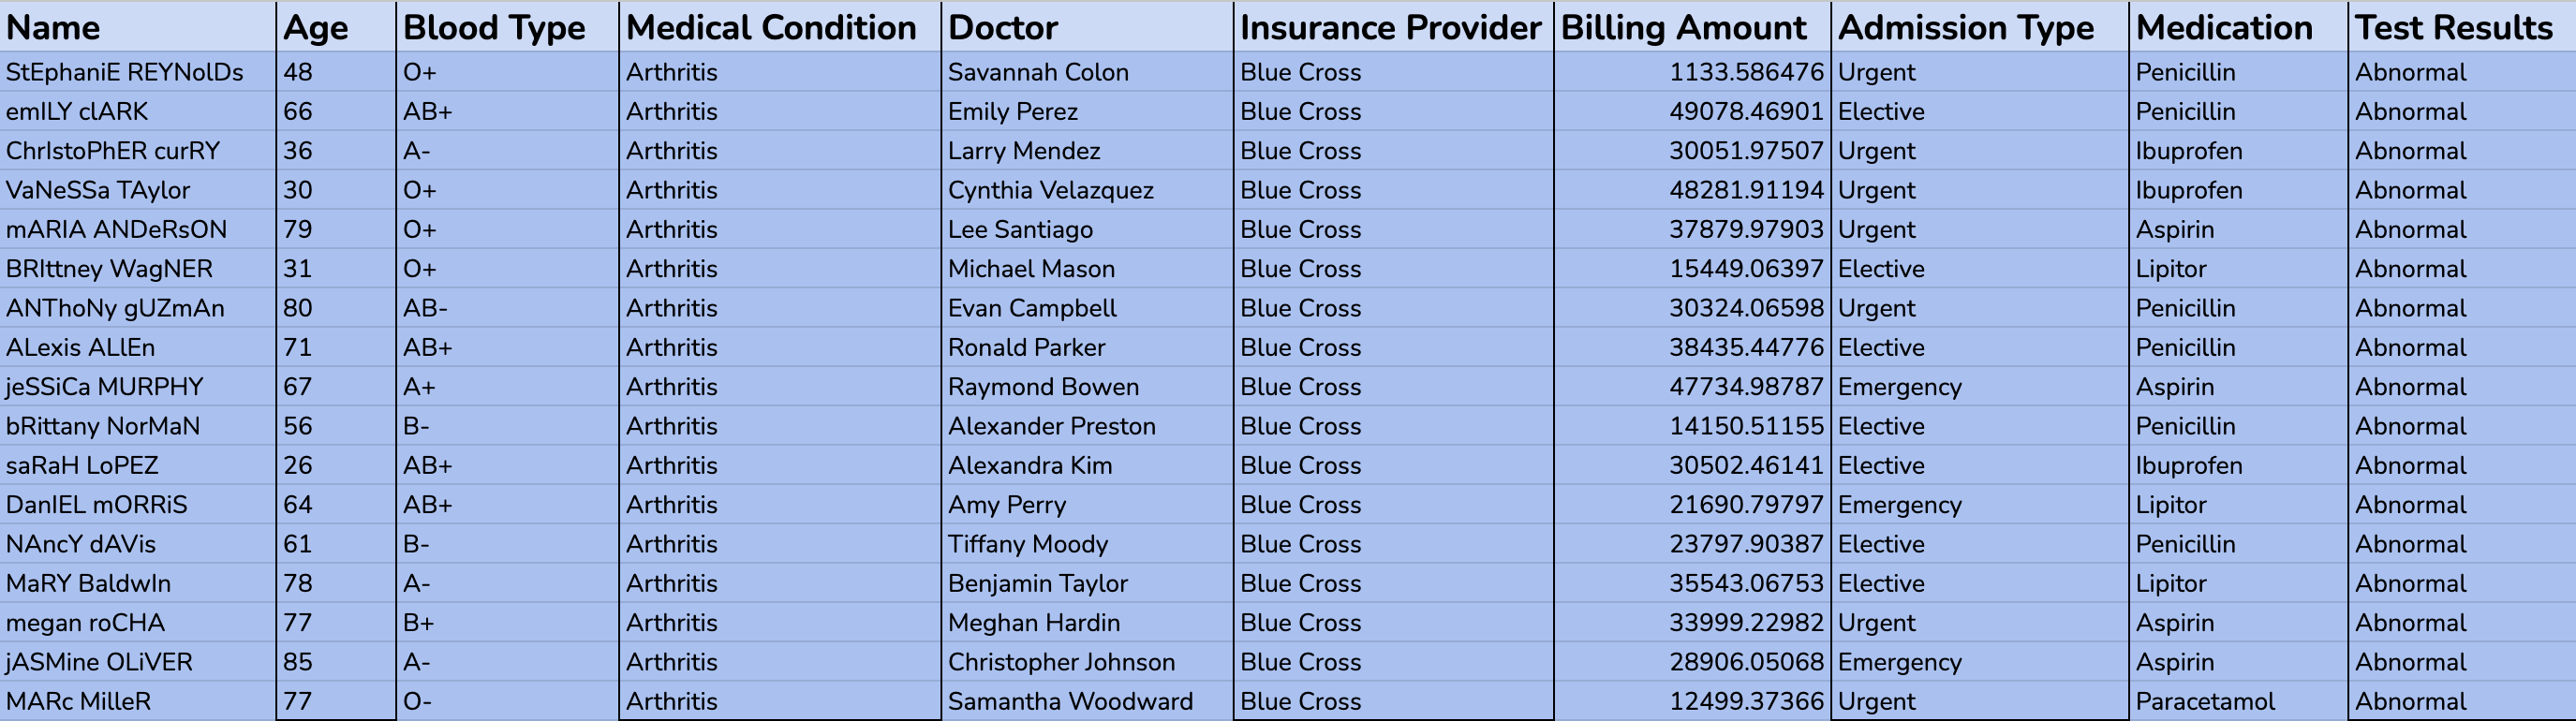
Original Data


Charts


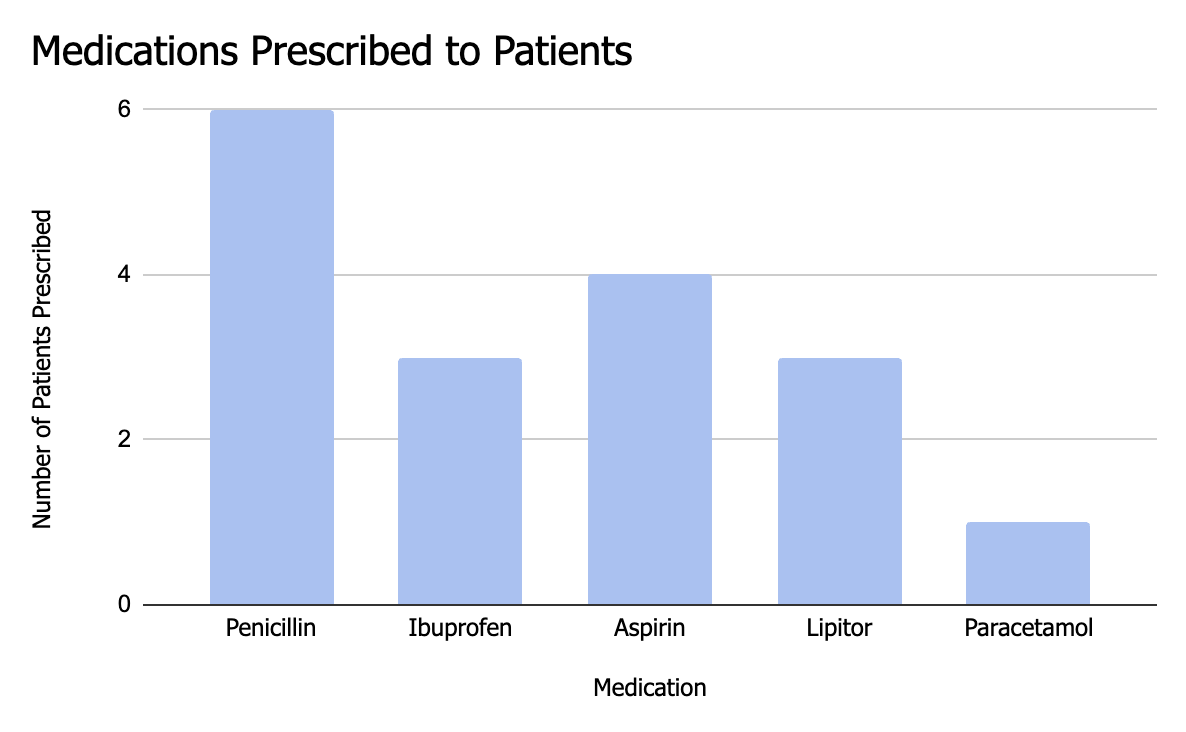
The bar chart above displays the medications female arthritis patients with abnormal test results insured by Blue Cross were prescribed, and how many patients were prescribed each medication. Looking at the height of the bars, we can see that Penicillin, which was prescribed to six patients, was the most common of the five medications prescribed to this patient group. However, we can see that while Penicilin was the most common medication, it was not consistently prescribed to patients across the board as the 6 patients prescribed it account for less than half the group.


The pie chart above shows the admission type distribution of female arthritis patients with abnormal test results insured by Blue Cross. From this chart we can see that Urgent and Elective were the most common hospital admission types for this patient group, with each category accounting for 41.2% of patients. Emergency hospital admissions, as we can see, were much less common for this group with only 17.6% of patients falling into this category. Even without looking at the specific percentages, we can easily understand the admission type distribution using the pie chart visual. It is easy to recognize that Urgent and Elective have bigger sized portions in the pie chart and account for the majority of patients, while the section for Emergency is much smaller.


The bar chart above shows the age distribution of female arthritis patients with abnormal test results insured by Blue Cross. From this chart we can see that the majority of patients were aged 60 or above. However, there was still a pretty wide age range for these patients with at least one patient in each of the 10 year sections between 20 and 60. We can also see that there were no patients under 20.